Reading Values off a Graph
Clicking the left mouse button inside the graph area draws a line parallel to
the Y axis and shows, as numbers after each label, the values at the points the
line crosses. The line disappears when you release the mouse; to keep it, press
 first. If you are in the middle of analysing a graph,
this command opens a modeless dialog of the values on screen, as shown.
first. If you are in the middle of analysing a graph,
this command opens a modeless dialog of the values on screen, as shown.
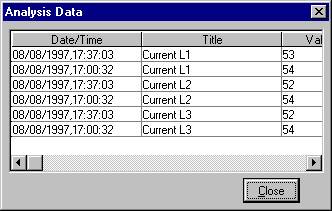
Figure 82 — Analysis Data dialog, showing the Date/Time, Title and Val (the value at the crossing point) columns, with a Close button
 finds the minimum, maximum and average over the
selected range (analysis).
finds the minimum, maximum and average over the
selected range (analysis).
 undoes the previous action — a zoom, or a use of
, and so on in order.
undoes the previous action — a zoom, or a use of
, and so on in order.
 exports the graph data to a text file or an Excel file.