3. View Menu
The View menu has two parts: general display items (items 1 to 4) and graph axis control (item 5 onwards).
1. Data Table
A sub-menu that shows the table of data received from the devices, before it is presented in the window you have built. Each device type has its own independent table, as shown.
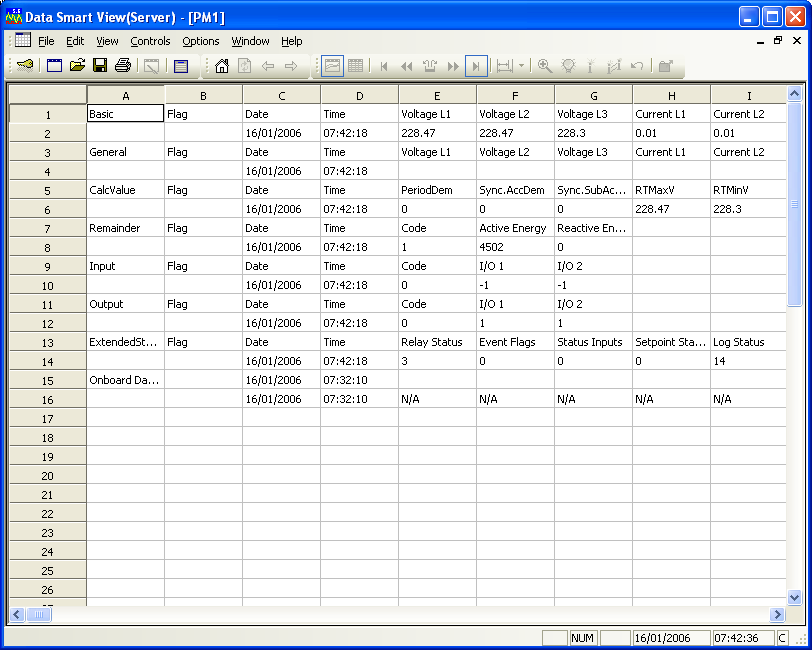
Figure 48 — Data Table: raw data from the devices
The table shows the data groups Basic, General, CalcValue, Remainder, Input, Output, ExtendedStatus and Onboard Data. Each row carries Flag, Date and Time columns along with the electrical values — Voltage L1–L3, Current L1–L2 and so on.
Note — a greyed-out menu item means that device has been disabled under File → Device Setup. Where a system has a large number of devices, the communication information can be appended to the device name; select that option under Options → General.
2. View Setup
Changes the settings of a view window you created earlier. The command opens a dialog on screen; which dialog appears depends on the type of window, exactly as it did when the window was first created.
Note
If you change anything and want the change to persist next time, you must save
it each time with File → Save or  .
.
3. Font
Sets the typeface and character style used in the windows. The font dialog is shown below. The default is MS Sans Serif, Bold, 8 point; each installation can adjust this to suit, to make the data easier to read.
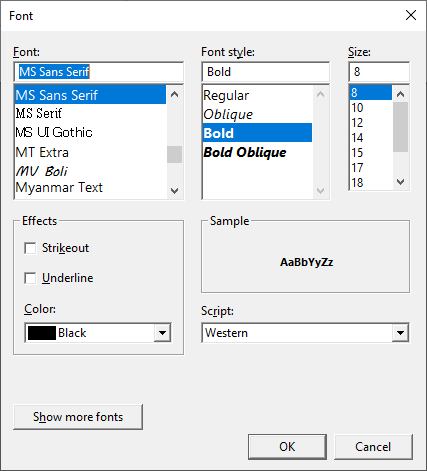
Figure 49 — Font dialog for setting the character style
The dialog contains a Font box (typeface), Font style (Regular/Italic/Bold/Bold Italic), Size (in points), an Effects section (Strikeout, Underline), Color and Script (normally set to Thai), together with a Sample box showing a preview.
4. Panel Bar
Shows or hides the various tool bars, as convenient.
5. Graph Movement
Has sub-items that mirror the tool bar; see the section on displaying graphs.
6. Graph Export
Exports the data held in the system to a text file, for use with MS-Excel — so that you can build graphs or analyse the data in other ways. The details are shown below.
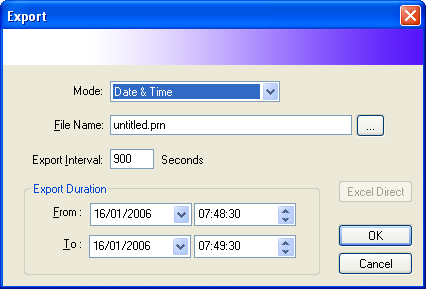
Figure 50 — Export dialog for exporting graph data
The dialog contains:
- Mode — the export format (Date & Time)
- File Name — the destination file name, with a Browse (...) button
- Export Interval — the interval per data point (default 900 seconds)
- Export Duration — the From and To date and time of the range required
- An Excel Direct button, which exports straight into Excel, plus OK / Cancel
7. User
Sets the graph axes independently: the X axis as a time span in HH:MM:SS (hours:minutes:seconds), and the Y axis as a minimum and maximum that you choose, as shown.
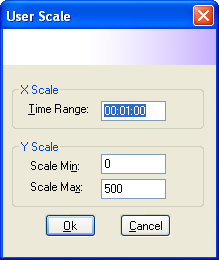
Figure 51 — User Scale dialog for setting the axis ranges by hand
The dialog has two parts:
- X Scale — Time Range, a time span in HH:MM:SS (for example 00:01:00)
- Y Scale — Scale Min / Scale Max, the lowest and highest values on the Y axis (for example 0 – 500)
8. 1 Min.
Sets the X axis to a one-minute span.
9. 10 Min.
Sets the X axis to a ten-minute span.
10. 30 Min.
Sets the X axis to a thirty-minute span.
11. 1 Hour
Sets the X axis to a one-hour span.
12. 6 Hour
Sets the X axis to a six-hour span.
13. 12 Hour
Sets the X axis to a twelve-hour span.
14. 1 Day
Sets the X axis to a one-day span.
15. 7 Day
Sets the X axis to a seven-day span.
16. 1 Month
Sets the X axis to a thirty-day span.
17. Show Maintenance
Used to check the state of data transfer between the computer and the devices. The details are shown below.
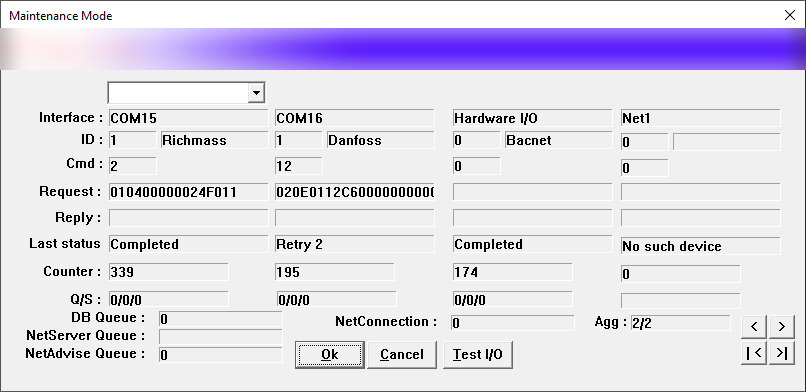
Figure 52 — Maintenance Mode dialog
The dialog shows the state of each interface in two columns (scroll through them with the < / > buttons). The fields shown are:
-
Interface — the COM port or network interface carrying the data (for example COM4, ETC1)
-
ID — the address and name of the powermeter (for example 2 — PM2)
-
Cmd — the sequence number of the command sent
-
Request — the hex string of the most recent command sent
-
Reply — the hex string of the data received back
-
Last status — the state of the transfer
Values of Last status
-
Success — the transfer was correct
-
Time Out — no data was transferred
-
CRC Error — the transferred data was corrupt
-
Error Retry — the transfer failed and the system is retrying
-
No such device — the device was not found
-
Counter — the cumulative number of transfers
-
Q/S — the current queue/sent counts
-
DB Queue / NetServer Queue / NetAdvise Queue — the queue length for each subsystem
-
Test I/O — a button for the system administrator to test I/O such as relays or analogue outputs
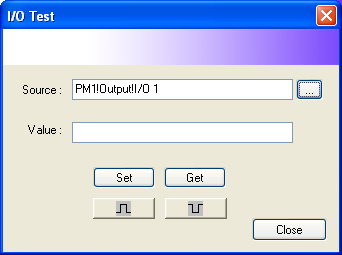
Figure 53 — I/O Test dialog
The dialog contains:
- Source — the I/O to test (for example PM1!Output!I/O 1), with a Browse (...) button
- Value — shows or accepts the value required
- Set / Get buttons for writing and reading the value; pulse-high (⎍) and pulse-low (⎌) buttons for testing relays; and Close to shut the dialog
18. Switch to MMI
Switches over to the MMI (Man Machine Interface) system to show the graphic display, if one is installed and running.
Note
Regarding items 5 to 16:
-
They take effect only on graph windows.
-
If you want a change to persist next time, you must save it each time with File → Save or
.