Quick Start
xView can be started automatically, by double-clicking the xView icon on the desktop, or from the Start menu. The xView program group looks like this.
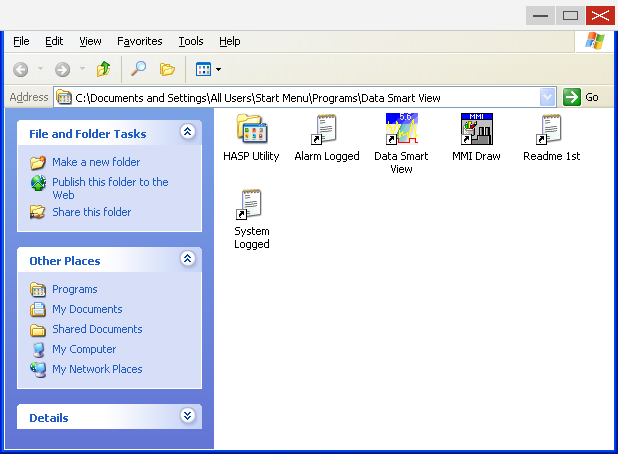
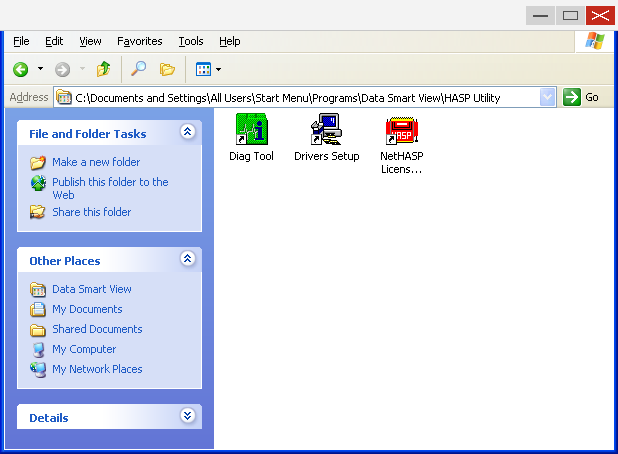
Figure 10 — The xView program group
Once xView starts, and after it has shown its logo and software copyright, the main program window appears, titled xView(Server). Its components are shown below.

Figure 11 — The main xView(Server) window
Across the top of the program is the menu bar, containing File, Edit, View, Controls, Options, Window and Help, together with a tool bar for the commands used most often.
At this point the program has already begun communicating with and receiving data from the devices, and is ready to accept commands and display data on screen for as long as required.
xView can be driven either from the menus or from the tool bar.
Tool bar shortcuts
Tool bar commands fall into three groups.
1. General commands
2. MMI system commands (not shown in some operating modes)
3. Graph commands
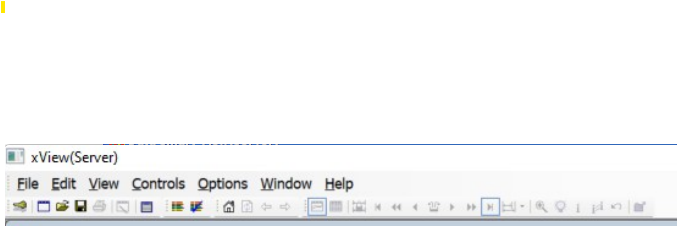
Figure 12 — Tool bar
Whether a given tool bar button is available depends on the type of display currently on screen (the active window).
Note
File → New refers to a menu command written as Main Menu → Sub Menu → Sub Menu. So File → New means the New item within the File menu.
Initial setup
The first time the system is used, its basic settings must be configured. Use the following menu commands.
-
File → Communication Setup
-
File → Device Setup
-
Options → General
-
Options → Data Log
Displaying data on screen
xView can display the values measured by the meters. The relevant commands are:
-
File → New, or

-
File → Open, or

-
File → Save, or

The data that can be displayed falls into the following types.
1. Instrument Window
Shows the detail of the various electrical values as they occur in real time, so that the whole picture can be taken in from a single window. The illustration below shows several window types open at once — a Graph Window and an Instrument Window (PM01 [MDB]).
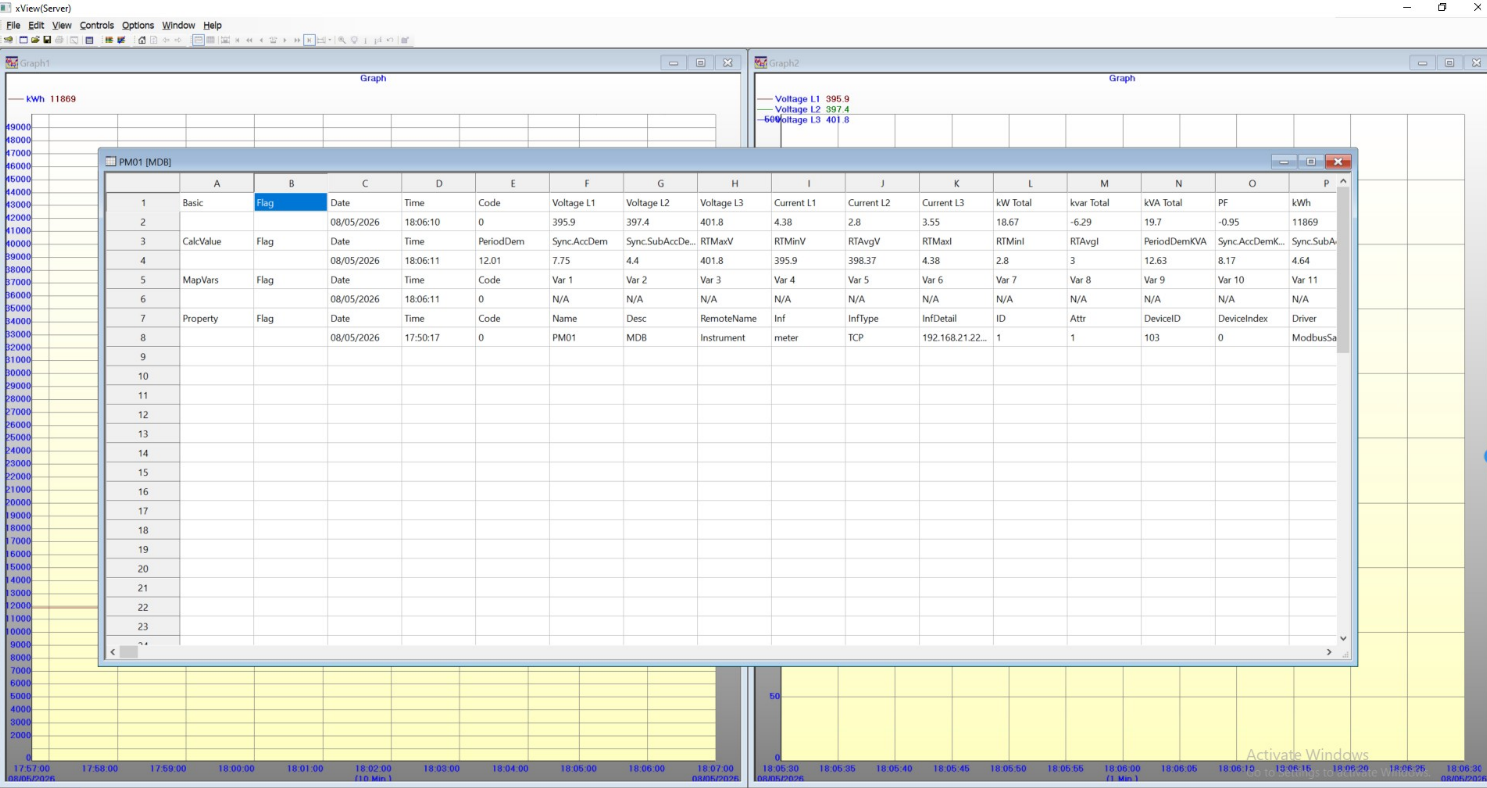
Figure 13 — Several window types open at the same time
2. Graph Window
Displays data as a graph (trend) from a set of values defined earlier — for example the three phase voltages shown as three lines.
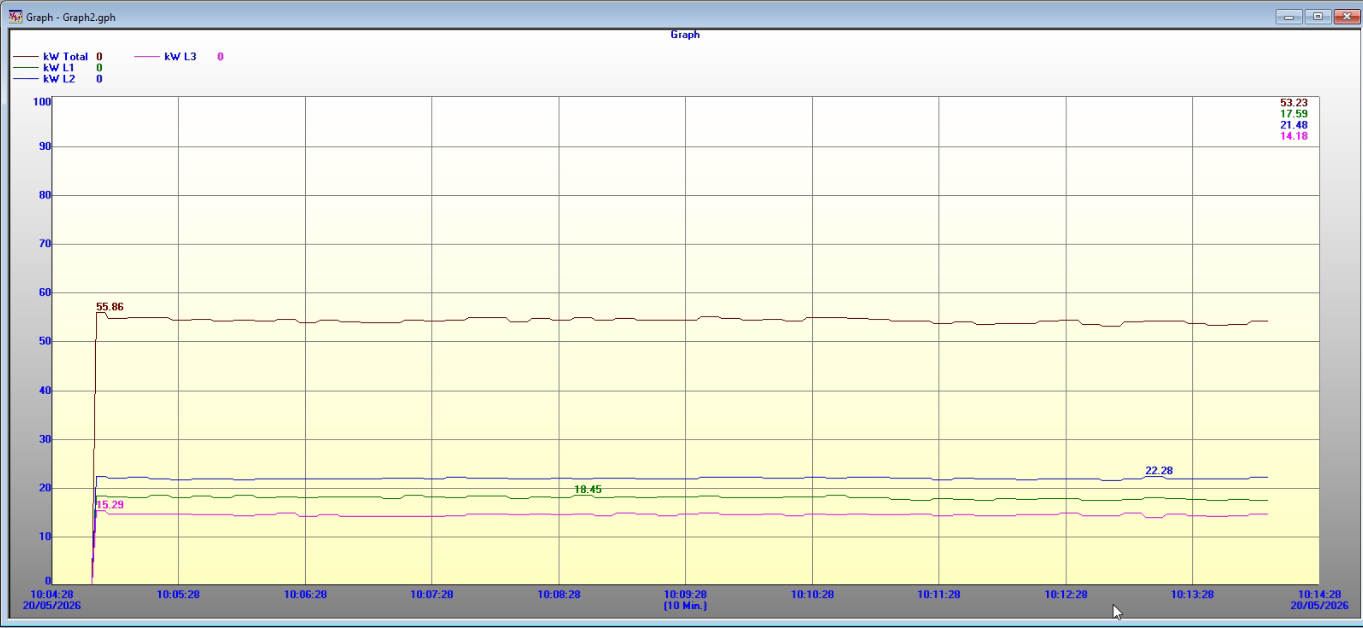
Figure 14 — Graph Window
3. Harmonic Spectrum Window
Displays the spectrum of the harmonics present in the system, as measured by those Digital Powermeter models that report harmonics. The spectrum shown runs from the 1st to the 31st order.
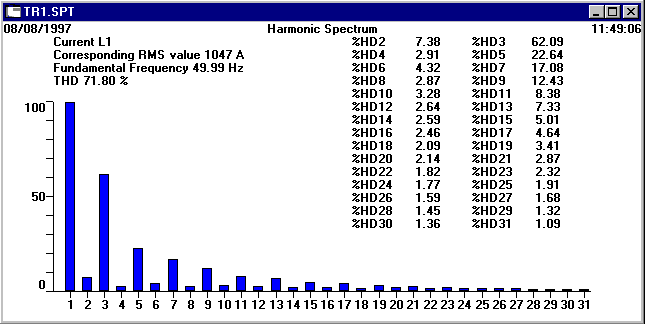
Figure 15 — Harmonic Spectrum Window
4. Harmonic Waveform Window
Digital Powermeter models that report harmonics can also capture the waveform of each phase, for both voltage and current. This window shows the result of that capture.
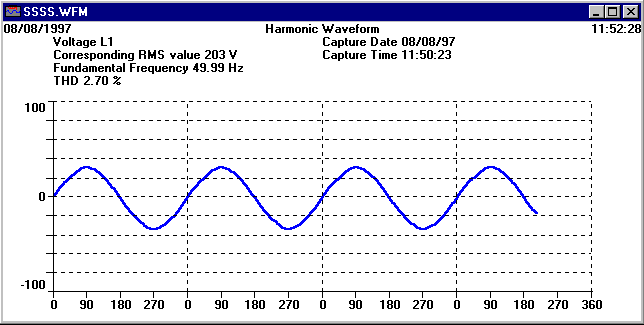
Figure 16 — Harmonic Waveform Window
5. Data Log Window
Some Digital Powermeter models can store electrical data and events inside the meter itself (data logger / events logger). The Data Log Window displays the data that has been uploaded out of the meter's memory and stored on the hard disk.
Note
See "Reading out the data recorded by the meter" for details.
Printing real-time and historical data
Whatever is shown on screen, in any window type, can be printed by using
File → Print or by clicking the printer button on the tool bar:

Closing a window you no longer need
Once a window has been opened on screen, it can be closed when no longer needed by clicking that window's close icon.
How passwords work
xView provides two ways of dividing users into levels: a password on its own, or a user name together with a password, which supports up to 99 levels. (For configuring password levels, see the xDraw manual.)
Table 3 — Password levels when using a password only
| No. | User level | Permitted operations |
|---|---|---|
| 1. | GUEST | No rights to any command; cannot shut the system down |
| 2. | USER | Normal day-to-day operation |
| 3. | SUPERVISOR | As USER, plus the right to change critical settings: Communication Start, Communication Stop, Communication Setup, Device Setup, User Set Points, Password Setup |

After every installation, the system password is set to blank for ordinary users
and to "1234" for the Controls menu. In other words, on first entering the
program after installation you are immediately at Supervisor level, so when the
system asks for a password simply press Enter, or press
 .
.
-
Only a Supervisor can change the password, using Options → Password.
-
Before working, use the Log On/Off command to select the level you want to work at; only then are the menu commands available.
-
When you have finished, enter Log On/Off again and press
 so that the system locks itself and prevents
unauthorised users (Guest) from getting in.
so that the system locks itself and prevents
unauthorised users (Guest) from getting in.
Notes
-
Set the passwords as soon as installation is complete. The system administrator holds the Supervisor password; other users whose job is to print or check data should only be given the User level password.
-
If the password is forgotten, reinstall the program.
Totalising and TOD maximum demand
If more than one powermeter is installed, xView can calculate combined and average electrical values — for example total active power across meters, or total accumulated demand. To display a combined value, select the entry from System in the Source field of the relevant setup.
In addition, for each powermeter the system calculates the maximum demand separately for each defined time band, and calculates the period demand — the electricity used over the period just elapsed (a 15-minute interval).
Electricity cost calculation and group totals
The program can calculate electrical totals as required, and work out the electricity cost immediately, which can then be viewed through a web browser. For configuring and viewing these, see the Group Setup and Report sections respectively.
Automatic end-of-month processing
On the last night of each month, or on a configured date and time, if the TOD system is in use (TOD Enable) the system automatically does the following.
-
Backs up the data for the month just ended.
-
Resets the maximum demand and accumulated values on every powermeter (depending on whether this has been enabled).
-
Synchronises the maximum demand period.