Analysing a Graph
The tool bar carries a  button that puts the graph into
analysis mode. With it pressed,
button that puts the graph into
analysis mode. With it pressed,  can be used to bring
in another set of graph lines for comparison. Pressing it opens a dialog similar
to Goto, as shown.
can be used to bring
in another set of graph lines for comparison. Pressing it opens a dialog similar
to Goto, as shown.
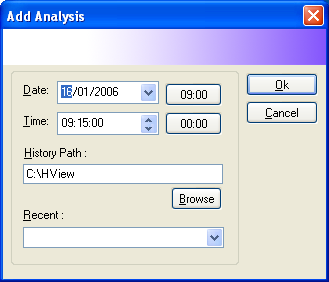
Figure 80 — Add Analysis dialog: the date, time and history path of the data to compare against
Analysis can keep adding lines indefinitely, and works alongside the other graph movement commands. A graph with comparison data mixed in looks like this.
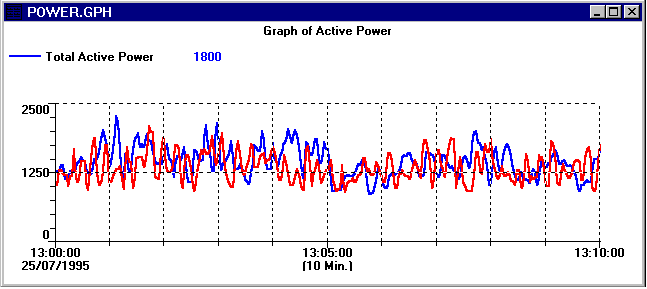
Figure 81 — Example of graph analysis
Note
When you have finished analysing, press again to leave
analysis mode, or press  to return the graph to the
present time.
to return the graph to the
present time.