5. Options Menu
1. General
Sets the conditions under which data is read from the devices connected to the system, along with various other settings. The command brings up the following dialog.
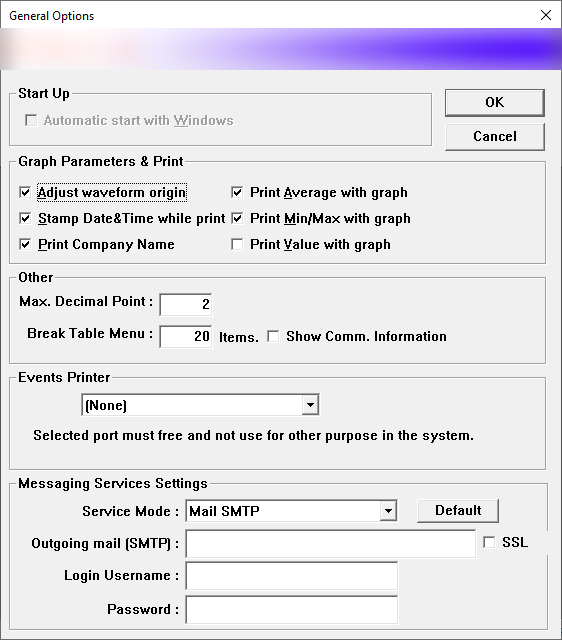
Figure 60 — General Options dialog
Start Up
- Automatic start with Windows — starts the program every time Windows is entered. (Only a Supervisor may set or change this.)
Graph Parameters & Print
-
Adjust Waveform origin — whether the program starts the waveform at the positive half cycle, or draws it exactly as received.
-
Stamp Date & Time while print — whether printed output carries the date and time it was printed.
-
Print Average with graph — whether printing or displaying a historical graph also shows the average value, as illustrated below.
-
Print Min/Max with graph — whether printing or displaying a historical graph also shows the hourly maximum and minimum, as illustrated below.
-
Print Value with graph — appends the value of the data to its name on the graph when printing.
-
Print Company Name — whether the site name appears on every display. The company or site name can only be set when the program is installed, or from the licence file.
Other
-
Max. Decimal Point — the greatest number of decimal places shown anywhere in the system (default 2).
-
Break Table Menu — with a large number of devices, the View → Data Table sub-menu becomes very long. This setting breaks it into a new column after the given number of entries (default 20). Set it to 0 to disable.
-
Show Comm. Info — shows which port each device is on and what its address or ID is, in View → Data Table. This makes it much easier to find the right entry when the system has many devices.
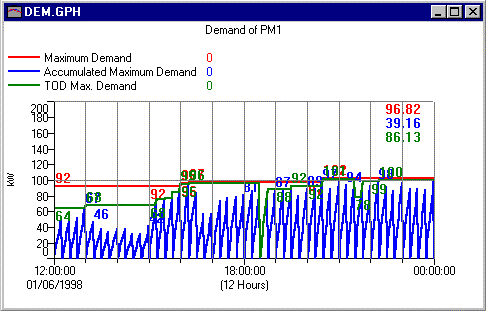
Figure 61 — Graph showing Maximum Demand, Accumulated Maximum Demand and TOD Max. Demand
The illustration shows three lines — Maximum Demand, Accumulated Maximum Demand and TOD Max. Demand — with the values shown to the right of the graph.
2. Data Log
Sets the conditions for recording data as a text file, so that it can be reviewed later in Microsoft Excel or another spreadsheet. All the settings are shown below.
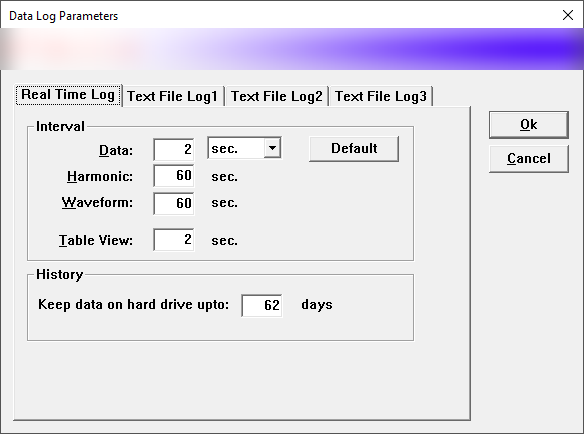
Figure 62 — Data Log Parameters dialog (Real Time Log and Text File Log tabs)
Real Time Log tab — real-time recording, used for historical graphs.
-
Data — the interval at which historical graph data is recorded. (The Default button restores the standard value.) A small number records in fine detail, which correspondingly increases the volume of data to store. The usual value is 2; the range is 0.052 (52 milliseconds) to 3600 seconds (1 hour).
-
Harmonic — the interval at which the harmonic spectrum is read, where a Digital Powermeter model that reports it is connected (default 60 seconds).
-
Waveform — the interval at which the harmonic waveform is read (default 60 seconds).
-
Table View — how often, in seconds, the data tables on screen are refreshed (default 2 seconds).
History
- Keep data on hard drive upto (days) — how many days of historical data to keep (default 180 days). Past that point the program deletes the data automatically, to conserve the disk space used for storage.
Text File Log tab — recording to text files for use in MS Excel.
-
Data Log Enable — whether data is recorded at all. To record the general electrical values, this must be ticked.
-
Interval (sec) — the interval between recordings, in seconds per record (default 60 seconds).
-
Files.Max — the greatest number of files to keep (default 500). Data is written sequentially from L0000001.PRN through to L0000500.PRN, after which it wraps around and overwrites file number 1 again. Files.Current shows which file number is currently being written (262 in the illustration).
-
Lines.Max — the greatest number of lines per file. Once a file exceeds it, data automatically continues in the next file (default 100). Lines.Current shows the line currently being written in the current file (46 in the illustration).
-
Column — how many values to record (default 42). With a Digital Powermeter model 290 or 270 connected, set 33; with a model that reports harmonics, set 40 so that THD (total harmonic distortion) is recorded too. The maximum of 42 also records TOD maximum demand and period demand.
-
Include all Instruments — when ticked, records data from every meter connected to the system.
-
Include all Parameters — when ticked, records every value, from the first through to the number set in Column.
-
Harmonic.Log Enable — as Data Log Enable, but governs recording of the harmonic spectrum only. The file names follow the same pattern, for example H0000001.PRN through H0000500.PRN.
-
Harmonic.Interval (sec) — the interval at which the harmonic spectrum is recorded, in seconds. Each recording writes 6 lines (V1, V2, V3, I1, I2, I3); default 60 seconds. Current File shows the current harmonic file number (262).
3. Database (advanced use, or the Enterprise option, only)
Configures a database for storing additional data. The details are shown below.
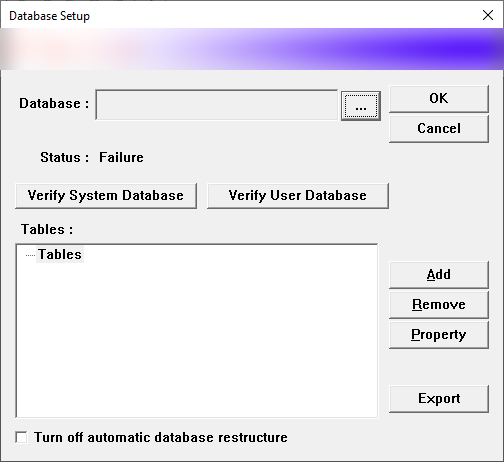
Figure 63a — Database Setup dialog
Database Setup — sets the database connection string (press ... to choose
it through the OLEDB dialog). Tables shows the table structures present in
the system; Add / Remove / Property manage them.
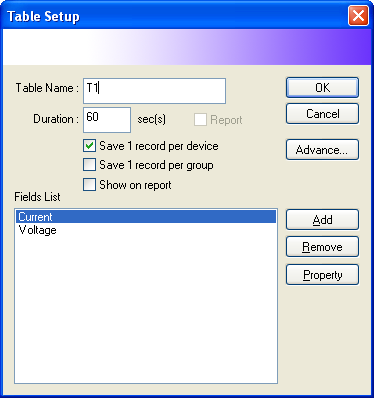
Figure 63b — Table Setup dialog
Table Setup — the properties of each table:
- Table Name — the name of the table
- Duration — the recording interval in seconds (default 60)
- Save 1 record per device / Save 1 record per group / Show on report
- Fields List — the fields in the table, with Add / Remove / Property buttons
- Advance... — opens Advanced Table Setup
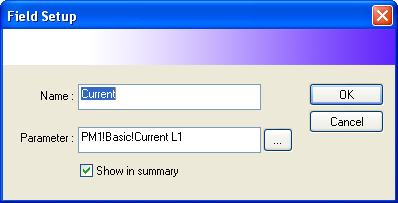
Figure 63c — Field Setup dialog
Field Setup — the properties of each field:
- Name — the name of the field
- Parameter — the parameter to record (press
...to pick it from the browser), for examplePM1!Basic!Current L1 - Show in summary — includes the value in the summary
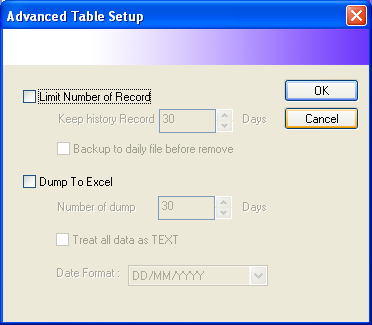
Figure 63d — Advanced Table Setup dialog
Advanced Table Setup — additional conditions:
- Limit Number of Record — caps the number of records stored; when full, data is kept for Keep history Record days (default 30), and can be backed up as a daily file before deletion
- Dump To Excel — exports to Excel automatically every Number of dump days (30); with Treat all data as TEXT and a Date Format (DD/MM/YYYY)
4. Legend and Colors
Sets the standard colours and the graph line markers (the legend) used when printing. The details are shown below.
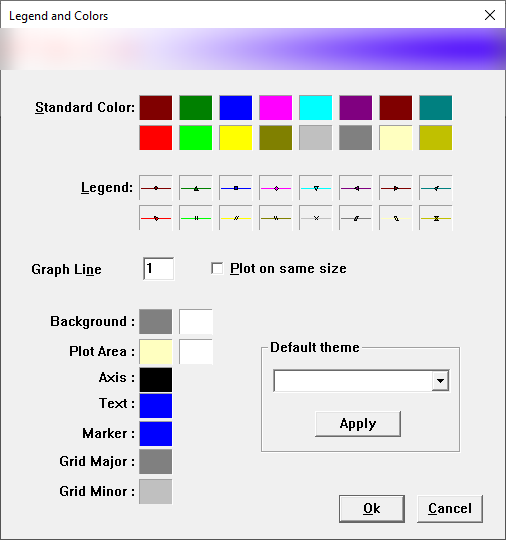
Figure 64 — Legend and Colors dialog
-
Standard Color
Adjust the colours to something suitable and easy to read. Click the colour you want, then press
 ; the colour dialog shown below
appears. Pick a colour from Basic colors, or set Hue / Sat / Lum and
Red / Green / Blue by hand. Check the result under Color|Solid and
press OK, or press Add to Custom Colors to add your colour to the
Custom colors palette.
; the colour dialog shown below
appears. Pick a colour from Basic colors, or set Hue / Sat / Lum and
Red / Green / Blue by hand. Check the result under Color|Solid and
press OK, or press Add to Custom Colors to add your colour to the
Custom colors palette.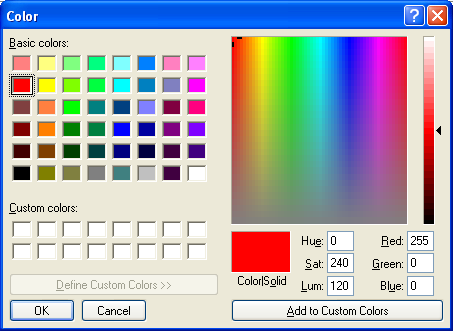
Figure 65 — Colour dialog
-
Legend
A graph printed on a colour printer is easy enough to read, but on a monochrome printer it becomes very hard. This section sets the markers drawn over the graph lines to make them easier to tell apart.
-
Graph Line Size
The thickness of the graph lines, both on screen and when printed (default 2).
-
Plot on same size
Draws all graph lines at the same thickness, which makes them easier to distinguish where they cross.
5. TOU Setup
Sets the operating conditions and the durations of the bands that the utility requires maximum demand to be separated into. TOU Setup has three tabs: Parameters, TOU and Reset.
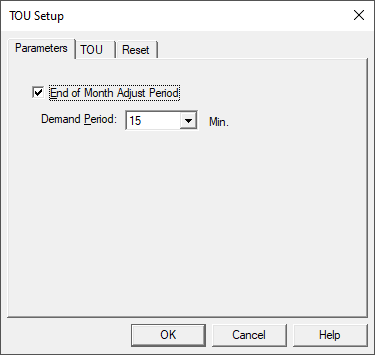
Figure 66 — TOU Setup dialog (Parameters tab)
To enable the function, set the following on the Parameters tab.
-
End of Month Adjust Period — adjusts the time base automatically at the end of the month. This should be set.
-
Demand Period (Min) — the period used for demand values (normally 15 minutes).
-
For the TOU tab, see the next section.
-
The Reset tab should be set as in the example, for a reset at each month end. Once configured, press Check Next to check the date of the next reset.
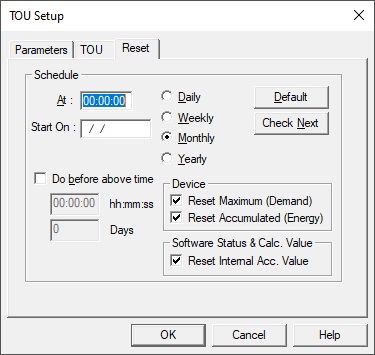
Figure 66b — TOU Setup dialog (Reset tab)
TOU Setup
The program can work out electricity demand for comparison in several ways — TOU (time of use), TOD (time of day) or flat rate, for example. You choose which methods to use here, under TOU Setup.
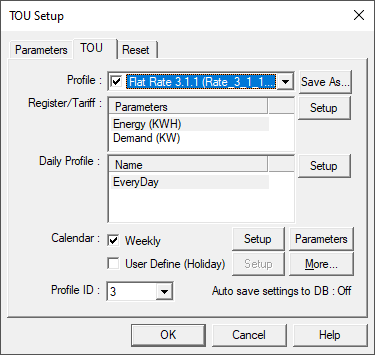
Figure 66c — TOU Setup dialog (TOU tab)
-
Profile — selects the method you want. A tick in front of a method means it is selected. (Click the mark in front of an option with the mouse to select or clear it.)
-
Save As — copies this method into a new file.
-
Register/Tariff — press the Setup button on the right to edit it. There you can choose the parameters you want, define the tariffs, and set the electricity rate for each tariff.
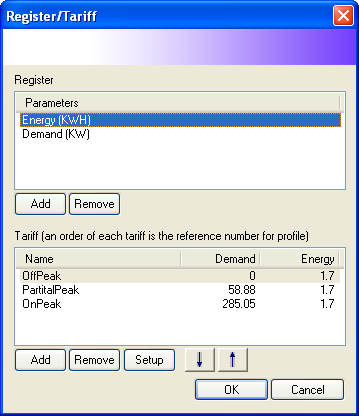
Figure 67 — Register/Tariff dialog
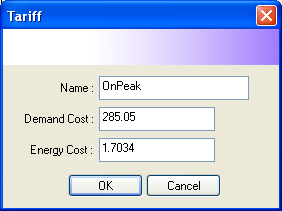
Figure 67b — Tariff dialog
- Daily Profile — defines how many charging patterns exist across a billing month (the daily profiles), and at what times each one switches to which rate (the tariff changes). Each cycle must run from 00:00:00 to the same time on the following day.
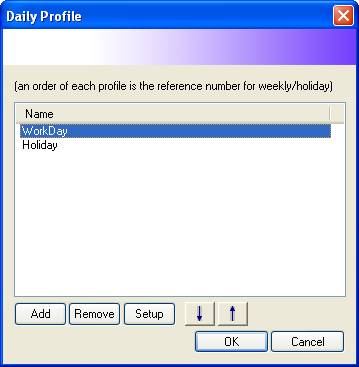
Figure 68 — Daily Profile dialog
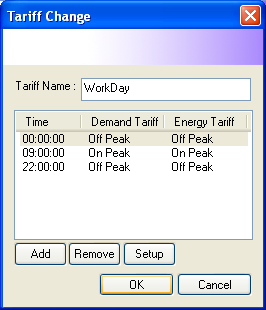
Figure 68b — Tariff Change dialog (list)
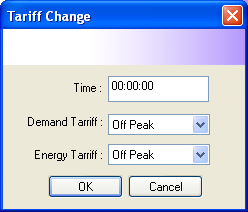
Figure 68c — Tariff Change dialog (detail)
- Calendar Weekly — defines whether the charging pattern changes to a fixed pattern within each week. If it does, configure it with the Setup button, choosing the pattern you want from the ones defined earlier, as shown.
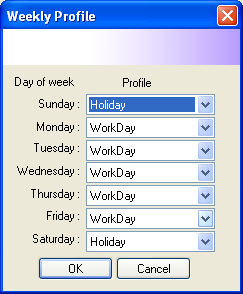
Figure 69 — Weekly Profile dialog
- Calendar User Define (Holiday) — defines which charging pattern applies on individual days, for cases a weekly pattern cannot express, or to set special daily charging conditions for the public holidays that the electricity authority designates, as shown.
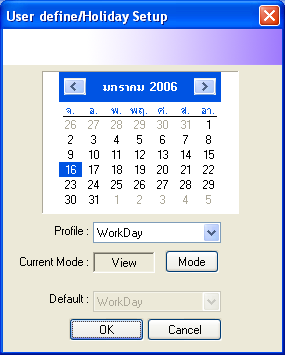
Figure 70 — User define / Holiday Setup dialog
In the illustration, Current Mode is View. In this mode, clicking through the days in the calendar shows the Profile box change according to whatever was set for that week, or to the default — depending on whether you configured the program to follow a weekly pattern earlier.
The illustration shows Profile as Workday. To change a particular day to something else — to make 1 January a holiday, say — do the following.
-
Press Mode to change Current Mode from View to Set.
-
Change Profile to what you want, in this case Holiday.
-
Click day 1 to set it as a holiday.
-
For any other days you want to make holidays, move to the required month and date with the arrow buttons at the top and click that date.
-
Press Mode again to return Current Mode to View.
-
Click through the days you changed to confirm that the profile really has changed as intended.
-
Press OK when you have finished in this dialog.
-
Press OK again to write the settings to disk.
-
Parameters — other values to be passed into the report, such as the Ft charge or VAT. You can come back and change these whenever the authorities publish new rates. (They must be changed for each selected profile in turn.)
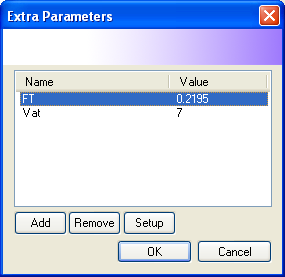
Figure 71 — Extra Parameters dialog
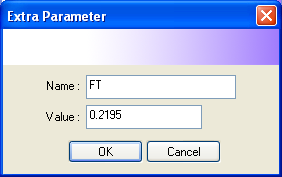
Figure 71b — Extra Parameter Setup dialog
- Reports — the template files used to generate reports, under
Calculation Template / Internal Reporting Template:
- Daily basis / Listing — the template file (for example TemplateFlatDaily.htm)
- Monthly basis / Billing — the template file (for example TemplateFlatBill.htm)
- Calendar Type — the reporting cycle (for example Standard 1st to Month's End), or press User Defined Period Setup
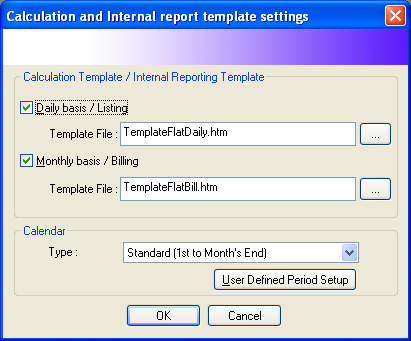
Figure 72 — Calculation and internal report template settings
6. Report
This has the following sub-items.
6.1 Report Setup
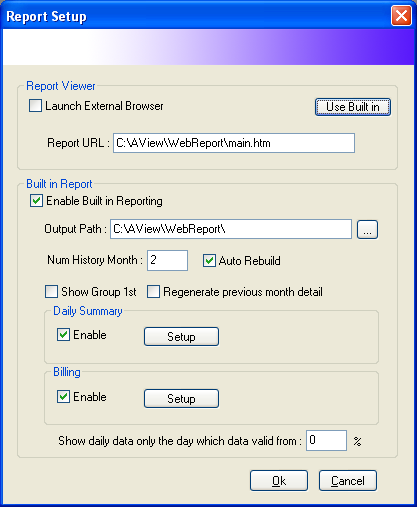
Figure 73 — Report Setup dialog (built-in reporting)
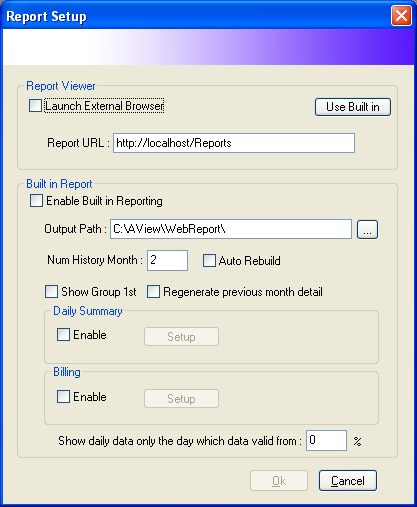
Figure 73b — Report Setup dialog (external browser)
Sets the conditions for generating reports automatically, in HTML, for viewing through a web browser.
Report Viewer — how the report is opened:
- Launch External Browser — opens it in an external browser; give the report URL (for example
http://localhost/Reports)- Use Built in — uses the built-in viewer; give the output path and set Num History Month and Auto Rebuild
Built in Report — available when Enable Built in Reporting is on:
- Show Group 1st / Regenerate previous month detail
- Daily Summary — enable it and press Setup
to set the conditions
- Billing — enable it and press Setup to set the conditions
- Show daily data only the day which data valid from — the minimum percentage required (default 0%)
Two kinds of report can be produced:
-
A summary of the electricity charges for the month, or for the configured period.
-
A report of the electrical values.
*For the advanced report, see the dedicated Advanced Report manual.
6.2 Generate Web Report
Tells the program to build the graphs immediately. (It normally does so automatically, around four times a day.) The system can also be run at once according to the options selected.
6.3 Generate Web Image (this feature will be withdrawn in a future release)
Generates the images defined in atcmmi.ini under the sections Bitmap1,
Bitmap2 and so on in order. Each section may hold several files, as given by its
Count entry.
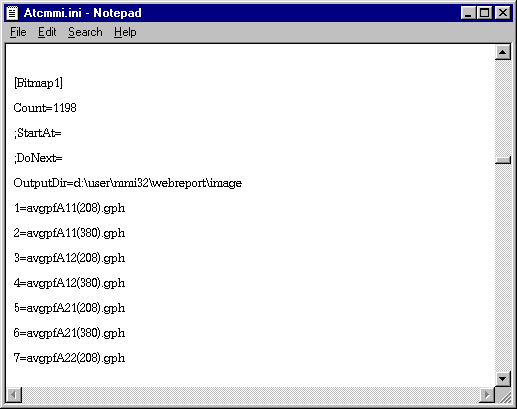
Figure 74 — Example of a bitmap definition section
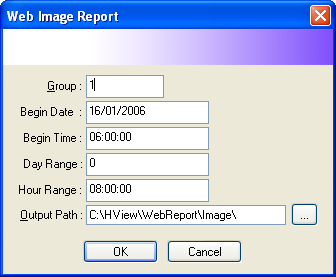
Figure 75 — Web Image Report dialog
In the illustration, the Group box is the bitmap section you want.
6.4 View
Opens the first page of the report in the machine's standard web browser, which may be Netscape or Internet Explorer.
See the documentation for whichever web browser you have.
8. Plug-In (advanced use only)
Enables other optional components. Most systems do not configure anything here. If your system does need it, separate documentation is supplied for each type of plug-in.
9. Password Setup
Sets the passwords used in the system. Only a Supervisor may do this. There are three levels — Password for Control menu, Password for user and Password for supervisor — as shown.
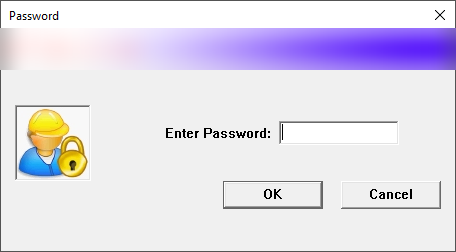
Figure 76 — Password setup dialog
Allow Exit determines whether users at User level have the right to shut the system down.
A password must be entered twice, to confirm it. If the two entries do not match, a warning appears when OK is pressed, as shown.
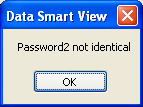
Figure 77 — Warning shown when the passwords do not match (Password not identical)
Note
See How passwords work for details.